Analytics and heat maps
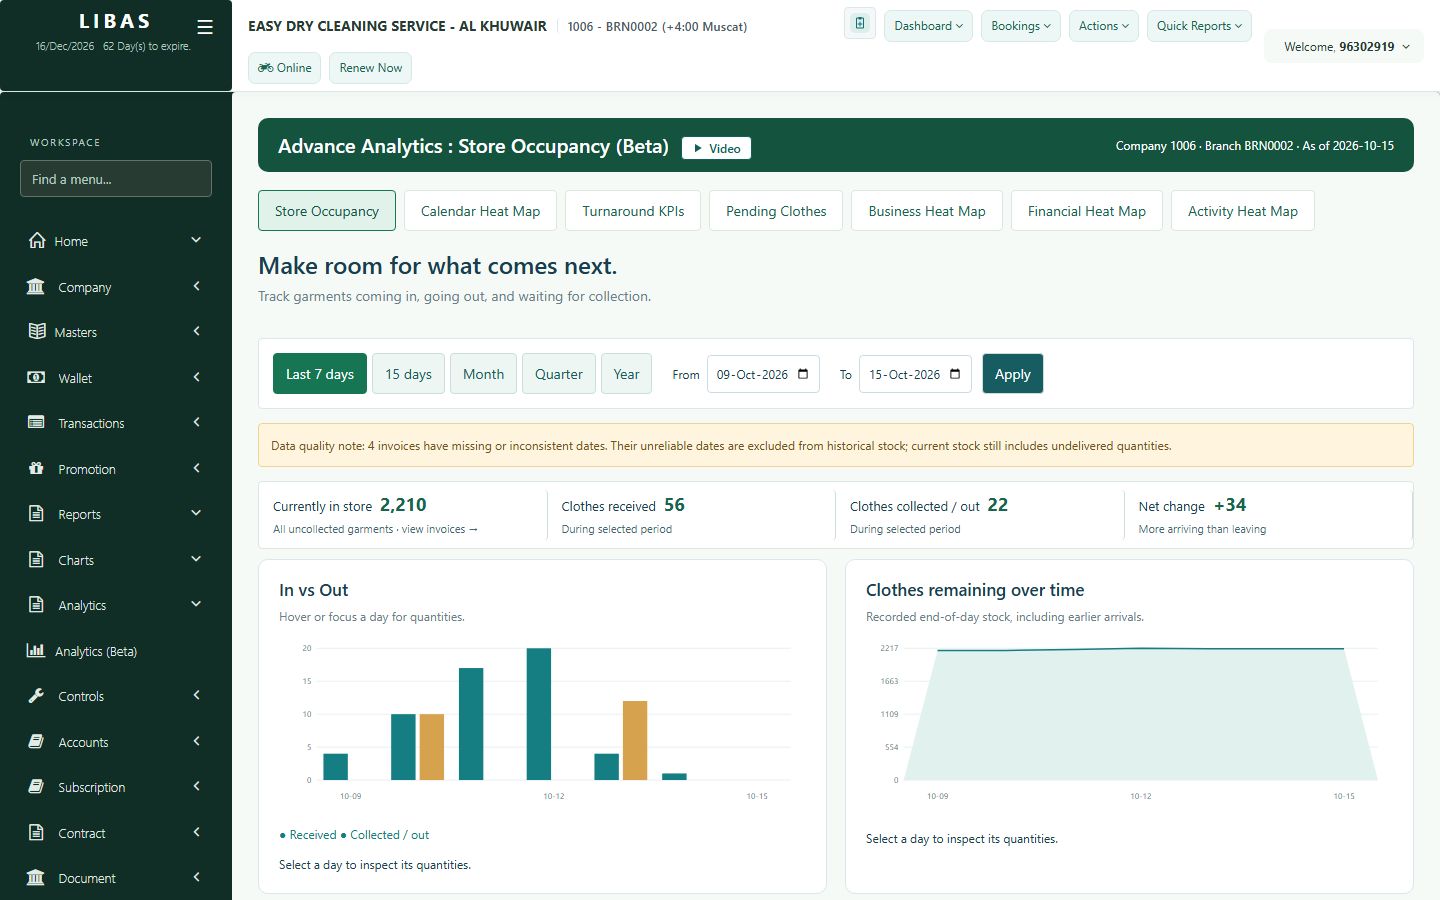
See your laundry in charts: clothes in and out of the store, how fast orders get ready, busy days on a calendar, and cash and card by day.
Where to find itAnalytics (Beta)
Steps
- Open Analytics (Beta).
- Store Occupancy: clothes received, collected and still in the store.
- Turnaround KPIs: how fast orders get ready.
- Calendar Heat Map: your busy days. Financial Heat Map: cash and card by day.
- Choose the period (7 days, 15 days, month, quarter, year) and press Apply.